-
JD Spinoza
JD Spinoza
JD enjoys teaching people how to use ZoomShift to save time spent on scheduling. He’s curious, likes learning new things everyday and playing the guitar (although it’s a work in progress).
- Jan 10, 2026
75+ Hotel Industry Statistics You Shouldn’t Ignore in 2026

While that still falls short of the $1.52 trillion valuation from a few years earlier, it represents meaningful progress. Let’s take a closer look at what the hotel industry looks like in 2026.
The Hotel Industry at a Glance
- The global hotel industry is expected to grow at 8.1% and reach US$1.27 trillion, 20% higher than the $1 trillion 2020 average. (Statista)
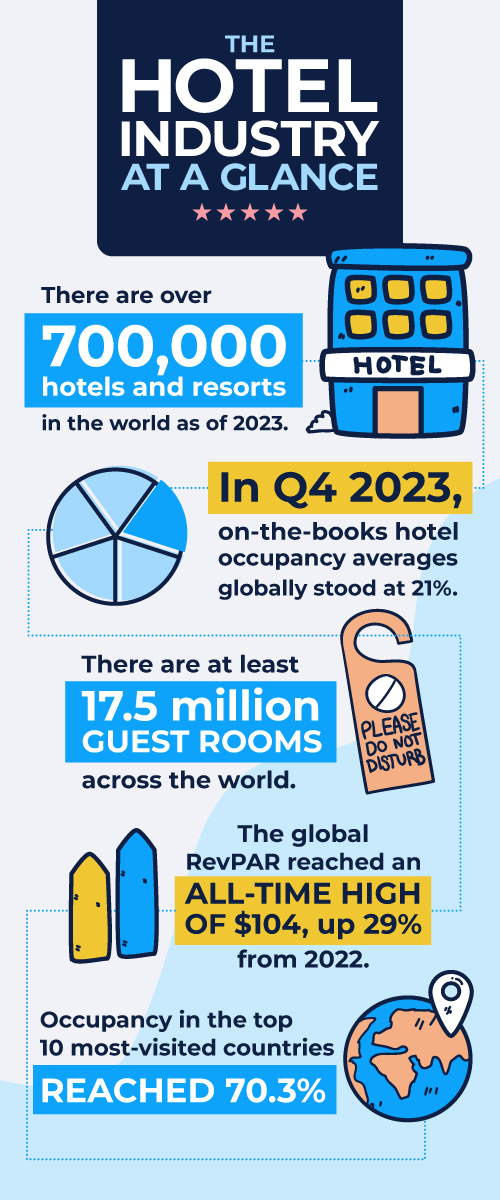
- There are over 700,000 hotels and resorts in the world as of 2023.
- From January to August 2023, hotel occupancy has maintained an average of 68% per month, a 10% increase compared to the same period in 2022 (62% average). (Amadeus)
- In June 2023, hotel occupancy reached its peak at 73%, signifying a 5% jump from June 2022. (Amadeus)
- In Q4 2023, on-the-books hotel occupancy averages globally stood at 21%. (Amadeus)
- 2,460 hotels were opened worldwide in 2023, up from 1,842 in 2022. This figure is expected to reach 2,707 in 2024. (Statista)
- There are at least 17.5 million guest rooms across the world.
- The global hospitality market reached a value of $4.7 trillion in 2023, with projections indicating an increase to $5.8 trillion by 2027 at a CAGR of 5.5%. (Statista)
- Global hotel occupancy rates in 2023 have consistently remained 10% higher compared to 2022 levels. (Amadeus)
- The global RevPAR reached an all-time high of $104, up 29% from 2022. (CoStar)
- Globally, the average RevPAR for 2023 stands at $116, which contrasts with the average of $99 in 2022 and $117 recorded in 2019 before the pandemic. (Amadeus)
- The global hotel industry is expected to reach $1052 billion in 2025 at a CAGR of 7%. (Alertify)
- Hotels experienced a 1.1% market growth YoY between 2018 to 2023.
- The global hotel occupancy for June 2023 was 32% compared to 36% in 2019. (Amadeus)
- Global average daily rates (ADRs) at hotels stand at $216 per room for June 2023, compared with $184 in June 2019. (Amadeus)
- Occupancy in the top 10 most-visited countries reached 70.3%, with China experiencing a 16.3% YoY increase, followed by Japan at 7.8% and Indonesia at 6.6%. (CoStar)
- Mexico is the only country in the top 10 to experience an 8.9% RevPAR decrease in 2023. (CoStar)
Europe, the Middle East, and Africa (EMEA) Industry Statistics
As travel made a comeback, the hotel industry has bounced back – with hotel security technology and hygiene innovations aiding this quick revival. In some places, it has even beaten pre-pandemic 2019 levels. And surprisingly, EMEA is set to lead the US in occupancy and RevPAR for the first time — and the good times are expected to continue into the winter.
However, as we’ve seen during the pandemic, travel trends can change rapidly. So, staying on top of hotel industry data is crucial. Let’s check out what 2023 has had in store for the hotel industry:
- According to the European Travel Commission, the travel intent of Europeans dropped 4% during the months of June to November 2023. (European Travel Commission)
- In 2022, 68% of worldwide sales in tourism and travel were made online. This figure is estimated to increase to 74% by 2027. (Statista)
- 94% of the guest reviews in the EMEA region are positive. (TrustYou)
- In Q2 and Q3, Turkey experienced the highest increase in ADR in Europe at 33%. (ETC)
- The hotel sector in Dubai achieved an average room occupancy of 76.0% in the first six months of 2023 with an ADR of US$145.50 and a RevPar of US$113.08.
- In Q1 2023, the average occupancy rate for Europe was 60%, only 5% less than 2019 levels. (CoStar)
- The Middle East and South America experienced the highest occupancy rates in Q1 2023 at 71% and 66%, 0% and 7% above 2019 levels. (CoStar)
- The average daily rates (ADRs) at hotels in the EMEA region experienced an average 15% increase compared to 2019, the highest worldwide. (CoStar)
- The latest data shows annual growth in RevPAR for Europe at 34.9%, occupancy growth at 17.7%, and ADR at 14.6%. (ETC)
- Western Europe continues to be the fastest-growing region in Europe, with RevPAR growing by 44.8%, occupancy growth of 25.3%, and ADR growth of 15.6%. (ETC)
- Scandinavian countries have experienced 7% to 9% higher ADRs and occupancy compared to 2022 levels. (ETC)
- The UK had the highest hotel occupancy among the most-visited countries in 2023 at 80.8%. (STR)
- In Q3 2023, Ireland, Denmark, Greece, Portugal, and the UK recorded occupancy rates above 80%, with Ireland leading with a record-breaking 91%. (STR)
- In Q4 2023, France experienced a RevPAR 123% above the global average, surpassing the US by a substantial 220% during the same period. (Amadeus)
- EMEA’s on-the-books occupancy for Q4 is presently 14% higher than 2022 levels, and there has been a notable 17% growth in RevPAR in 2023 compared to the rates achieved in 2022. (Amadeus)
U.S. Hotel Industry Statistics
Although domestic travel spending has stepped back somewhat, the 2023 hotel industry largely resembles the pre-pandemic travel economy. Let’s understand what makes it so similar.
- The U.S. hotel and motel industry is worth $177.6 billion. (Zippia)
- There are 166,272 hotels and motels in the U.S. as of 2023, 30,000 more than in 2022. (IBIS)
- In 2023, the hotel industry is expected to exceed 1.3 billion occupied room nights, 57% higher than 2020’s total. (AHLA)
- The average U.S. hotel occupancy rates are expected to reach 64% in 2023, two percent less than 2019’s average. (AHLA)
- The hotel occupancy rate reached 68.5% in the U.S. in Q3 2023, ADR rose to $164.97, and RevPAR to $112.96. (STR)
- In Q1 2023, the average occupancy rate in North America was 60%, only 3% less than pre-COVID levels. (CoStar)
- According to Expedia, flight searches for Q3 are up 15%, and hotel searches increased 20% compared to fall 2022.
- The hotel industry’s growth slowed during the second quarter of 2023, mainly because of a decline of 1.5% in YoY occupancy rates. (CBRE)
- In Q1 2023, the RevPAR of US hotels exceeded Q1 2019 levels by 13%. (PwC)
- U.S. hotels and motels grew by 8.5% in 2023. (IBIS)
- In Q1 2023, total airline passengers exceeded 2019 levels even though there were 41% fewer inbound international travelers. (CBRE)
- As of Q4 2023, NORAM is positioned to surpass the global average occupancy by 5%. And while LATAM typically lags slightly behind global occupancy trends, it has seen a notable 6% improvement compared to bookings made at this same time in 2022. (Amadeus)
- The Q4 on-the-books occupancy for NORAM is presently running 5% ahead of the levels seen in 2022. (Amadeus)
Hotel Industry Consumer Preference Statistics
Customers with diverse cultural backgrounds often have varying preferences when it comes to hotel amenities and services, and these differences significantly impact hotel revenue. This makes it crucial for hotels to understand what drives customer satisfaction.
Let’s understand what customers expect from hotels in 2023:
- About 73% of people are feeling more positive about travel in 2023 than they did in 2022, according to Booking.com.
- According to FinancesOnline, around 40% of consumers choose a hotel depending on where they’re staying.
- Hotels with high-quality photos of rooms and amenities experience a 15% higher conversion rate than those without.
- Millennials are all about experiences these days. In fact, a whopping 78% prefer to spend their cash on experiences instead of material things.
- Hotels with 100+ Google My Business images get 1,065% more website clicks than average businesses. (brightlocal)
- Booking.com says 42% of travelers want vacations that help them unwind and stay healthy.
- Around 37% of consumers prefer to stay at a hotel than a shared accommodation.
- More than 55% of people traveling with their family chose hotels for their stay, 21% went for a resort, while 17% stayed with relatives or friends. (Golden Tourism)
- Almost 50% of hotel bookings are made online. So, hotels looking to attract more clients must have an online presence. (Hospitality Net)
- 27% of business travelers want hotels to provide self-check-in and check-out kiosks. (Statista)
- 80% of travelers read reviews before booking a hotel. (MediaRoom)
- 83% of Americans prefer to book their hotel stays online, usually through mobile apps or websites.
- In 2023, 64% of hotel reservations were made within seven days of travel, but this figure dropped to 51% in 2023, close to the 50% figure seen in 2019. (Amadeus)
Hotel Industry Technology Statistics
The hospitality game keeps changing and new trends keep popping up. Tech is stepping up, making things smoother behind the scenes and cooler for guests. So, if hotels want to keep making money in this competitive world, they’ve got to keep up with these fresh trends.
Hotel management software is a key player in this evolution, helping to streamline operations and enhance the guest experience.
Let’s understand what hoteliers are doing to improve guest experience and increase bookings:
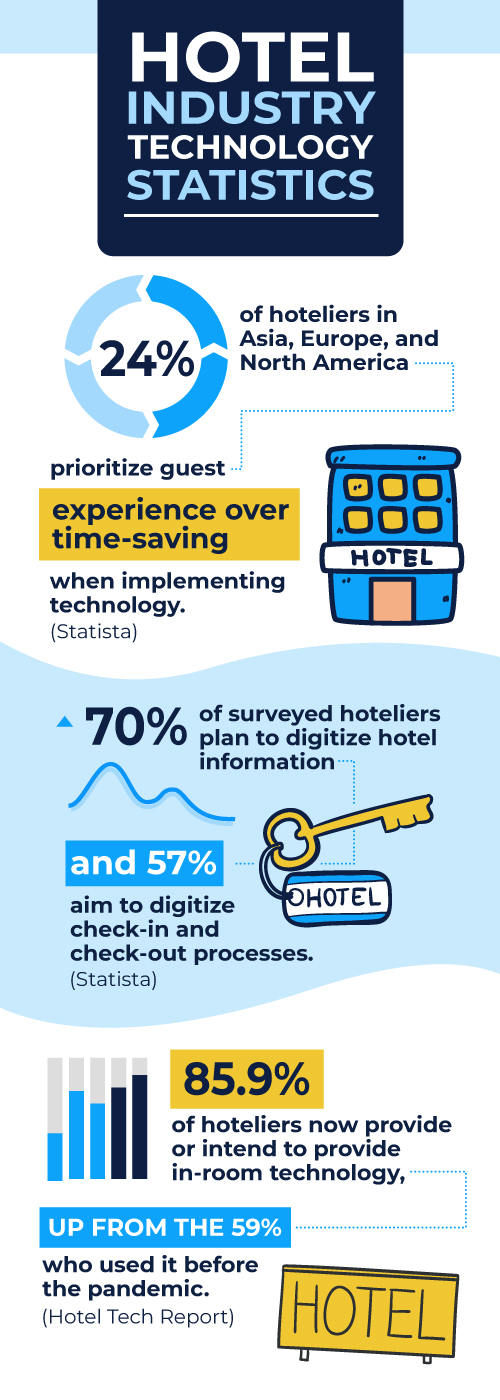
- 24% of hoteliers in Asia, Europe, and North America prioritize guest experience over time-saving when implementing technology. (Statista)
- 70% of surveyed hoteliers plan to digitize hotel information and 57% aim to digitize check-in and check-out processes. (Statista)
- 85.9% of hoteliers now provide or intend to provide in-room technology, up from the 59% who used it before the pandemic. (Hotel Tech Report)
Hotel Industry Employment Statistics
While hospitality is one of the fastest-growing industries in the US, it experienced a significant dent in 2020 due to the pandemic. Let’s look at what the employment situation in the industry looks like:
- In May 2023, job openings per hotel averaged 21, down from 24 in 2022 but above 2019 levels. (CBRE)
- Between 2021 and 2031, the U.S. economy will experience an increase of 8.3 million jobs, with leisure and hospitality accounting for 23.1% of them. (BLS)
- As of August 2023, the average salary for a hotel worker in the United States is around $44,111, generally ranging from $34,911 to $55,676. (Salary.com)
- Around 2.4 million people are part of the hotels and motels industry as of 2023, and the average business in the industry has 12.4 employees. (IBIS)
- As of Q3 2023, the average hourly pay for a hotel worker stands at $21, with typical earnings ranging from $17 to $27. (Salary.com)
- The average annual unemployment rate in the leisure and hospitality industry stands at 5.8%, the third lowest rate witnessed in the past decade. (BLS)
- In comparison to other sectors, only mining exceeds the 6.5% job loss seen in the leisure and hospitality sector. (U.S Travel Association data)
- Approximately 15.11 million individuals are employed within the U.S’s hospitality and leisure sector. (Statista)
- The U.S. accommodation sector provides jobs for around 1.6 million individuals. (Zippia)
- The jobless rate in the accommodation sector stands at 8%, double the national average. (Zippia)
- Employment numbers in the Leisure and Hospitality field rose by 35,000 in October, with the Accommodation sector contributing 20,000 of those positions. (Hotel News Resource)
- Last year, the U.S. saw a 10% rise in job vacancies in the leisure and hospitality sector since January. (Quartz)
- Currently, there are over 10,580 individuals working as hospitality representatives in the U.S. (Zippia)
- Half of the hospitality representatives in the U.S. are female. (Zippia)
- 2023 has marked a notable upswing in employment for the U.S Hotels & Motels industry. (IBISWorld)
- The annual unemployment rate in the leisure and hospitality field surpasses that of many other industries. (Workforce)
- The Leisure and Hospitality sector recently reported a loss of 1.1 million positions. (U.S Travel Association)
Final Thoughts
With global occupancy surpassing 2022 levels and RevPAR reaching new highs, the hotel industry continues its recovery. Europe leads with some of the strongest ADRs and occupancy rates since 2019, followed closely by the Middle East.
This progress highlights the industry’s ability to adapt — balancing evolving travel trends with new technologies to enhance the guest experience.
In the fast-paced world of hotel management, tools like ZoomShift provide a single source of truth that helps teams stay aligned and operate more efficiently in 2026.
JD enjoys teaching people how to use ZoomShift to save time spent on scheduling. He’s curious, likes learning new things everyday and playing the guitar (although it’s a work in progress).