-
JD Spinoza
JD Spinoza
JD enjoys teaching people how to use ZoomShift to save time spent on scheduling. He’s curious, likes learning new things everyday and playing the guitar (although it’s a work in progress).
- Jun 14, 2026
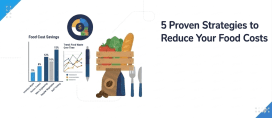
How to Calculate Food Cost in a Restaurant (And What Your Number Is Telling You)

Food costs are one of the largest controllable expenses in any restaurant. Most operators track them, but only a few understand what their number actually means, or what is driving it.
Calculating food cost correctly is the starting point for every meaningful procurement decision. It tells you where your margins are, where they are being compressed, and where the structural issues are hiding.
This article covers how to calculate food cost percentage, how to interpret your result against industry benchmarks, and what the number reveals about your operation.
What food cost percentage actually measures
Food cost percentage measures how much of your revenue is consumed by the cost of the food and beverages you sell. It is expressed as a percentage of total sales.
It is one of the most-watched numbers in restaurant operations because it connects directly to profitability. When food cost percentage rises, margin shrinks, even if sales are flat or growing.
Industry guidance places the optimal range at 28-35% of total revenue for most restaurant formats. The current industry average for full-service restaurants sits at approximately 32.4%.
The same food cost percentage can look very different depending on how pricing is structured, what you are buying, and what your distributor agreement looks like beneath the surface. The percentage alone gives you an outcome. Understanding the drivers requires a deeper look.
The food cost formula
The standard formula for calculating food cost percentage is:
Food Cost Percentage = (Cost of Food Used ÷ Food Sales) × 100
To find cost of food used, you need three numbers:
- Beginning inventory value (what you had at the start of the period)
- Purchases made during the period
- Ending inventory value (what you have left)
Cost of Food Used = Beginning Inventory + Purchases − Ending Inventory
A straightforward example
A restaurant starts the week with $8,000 in inventory. They purchase $12,000 in food and beverages during the week. At the end of the week, they count $7,500 remaining.
Cost of food used: $8,000 + $12,000 − $7,500 = $12,500
If food sales for the week were $40,000:
Food cost percentage: ($12,500 ÷ $40,000) × 100 = 31.25%
That number falls within the standard benchmark range. Whether the pricing behind it is competitive depends on the concept, the price point, and what is happening at the distributor level.
How to calculate food cost per dish
Costing individual dishes gives you a more precise picture than the overall percentage. It is the foundation of menu engineering and the starting point for understanding where margin is being made or lost at the item level.
Cost per dish = sum of ingredient costs at the quantity used in each serving
To cost a dish accurately:
- List every ingredient used in a single serving
- Calculate the cost of the exact quantity used, at the per-serving level rather than the purchase unit price
- Account for yield loss from trimming, cooking shrinkage, and waste
- Sum the ingredient costs to get the total plate cost
Plate cost percentage = (Plate Cost ÷ Menu Price) × 100
A dish that costs $7.20 to produce and sells for $24 has a plate cost percentage of 30%.
Most operators know their overall food cost. Far fewer cost individual dishes with enough precision to know which menu items are protecting margin and which are compressing it.
What benchmarks to measure against
The right food cost target depends on the restaurant format. Applying a single benchmark across different concepts produces misleading conclusions.
| Restaurant type | Target food cost range |
| Fine dining | 28-35% |
| Casual / full service | 28-33% |
| Fast casual | 25-31% |
| Quick service | 22-28% |
These ranges assume menu pricing is set correctly for the market and that the underlying ingredient costs are competitive. Many independent restaurants fall inside the benchmark range on paper while still overpaying significantly at the SKU level.
A food cost percentage within the target range tells you the ratio looks acceptable. It says nothing about whether the base costs driving that ratio are as low as they should be.
The part of food cost most operators miss
Calculating food cost percentage correctly tells you the outcome. Understanding what is driving it requires looking at the structure behind the number.
The most common hidden driver for independent restaurants is distributor pricing structure.
Broadline distributors earn gross margins of roughly 20-25% on independent restaurant accounts. On national chain accounts, that margin is closer to 10-15%. Chains negotiate from structured contracts with defined cost benchmarks, inflation protections, and auditable pricing models. Independent restaurants typically operate under standard agreements without those protections.
An independent restaurant buying the same products as a national chain, from the same distributor, can pay meaningfully more per case every week without realizing it. That gap flows directly into the food cost percentage.
There are three specific places where independent operators consistently lose ground:
SKU-level pricing drift
Without a contract that defines pricing benchmarks, individual item prices can drift upward incrementally. The changes are small enough that they rarely trigger a review, but they compound over time across a full order guide.
Missing manufacturer rebates
Distributors receive back-end payments from manufacturers that are sometimes passed through to operators and sometimes retained. Without visibility into how those programs work, operators cannot verify whether they are receiving the benefit.
Contract non-compliance
Even when a formal agreement exists, invoice pricing does not always reflect contracted terms. In high-SKU environments, compliance errors go undetected for months. Forensic audits regularly surface five-figure annual sums through compliance review alone.
None of these appear in the food cost formula. The formula produces a ratio. Recovering the margin those issues represent requires a different level of visibility into the purchasing structure.
How to use your food cost number
Tracked correctly and consistently, food cost percentage is one of the most useful diagnostic tools in restaurant operations.
Track it weekly, not monthly
Monthly tracking smooths out problems that could be caught and corrected immediately. Weekly tracking surfaces drift before it becomes a structural issue.
Break it down by category
An overall food cost percentage of 32% tells you less than knowing that proteins are running at 38% and dry goods at 19%. Category-level tracking identifies where purchasing improvements would have the most impact.
Compare it to your menu mix
A rising food cost percentage alongside flat or growing sales often points to menu mix shifts, where customers are ordering lower-margin items, or to ingredient cost increases that have not yet been reflected in menu pricing.
Benchmark it against your contract
A food cost percentage inside the standard range combined with a distributor margin of 22-25% means there is likely room to recover meaningful savings through a renegotiated agreement, with no changes to the menu or suppliers required.
What to do if your number is off
When food cost percentage sits consistently above the target range for a given format, working through the potential causes in the right order saves time.
Start with operations. Inventory controls, portion consistency, waste tracking, and over-ordering are the most immediate levers and the ones operators have the most direct control over.
Then review menu pricing. When ingredient costs rise and menu prices hold flat, the math compresses regardless of how efficient the kitchen is running.
Then examine the purchasing structure. When operations are tight and pricing is appropriate but food cost remains elevated, the issue usually sits at the distributor level, in the pricing structure, contract terms, or compliance.
That third category is where most independent operators look last. It is also where some of the largest recoverable savings tend to sit.
FoodServiceIQ works with independent restaurant groups to analyze purchasing structure, benchmark distributor pricing, and identify where food costs are being driven by contract and pricing issues rather than operations. If you spend at least $1 million annually on food with a major broadline distributor, we can show you exactly where your pricing stands and what is recoverable. Visit foodserviceiq.com to get started.
JD enjoys teaching people how to use ZoomShift to save time spent on scheduling. He’s curious, likes learning new things everyday and playing the guitar (although it’s a work in progress).