-
JD Spinoza
JD Spinoza
JD enjoys teaching people how to use ZoomShift to save time spent on scheduling. He’s curious, likes learning new things everyday and playing the guitar (although it’s a work in progress).
- Feb 14, 2026
45 Restaurant Industry Statistics for 2026
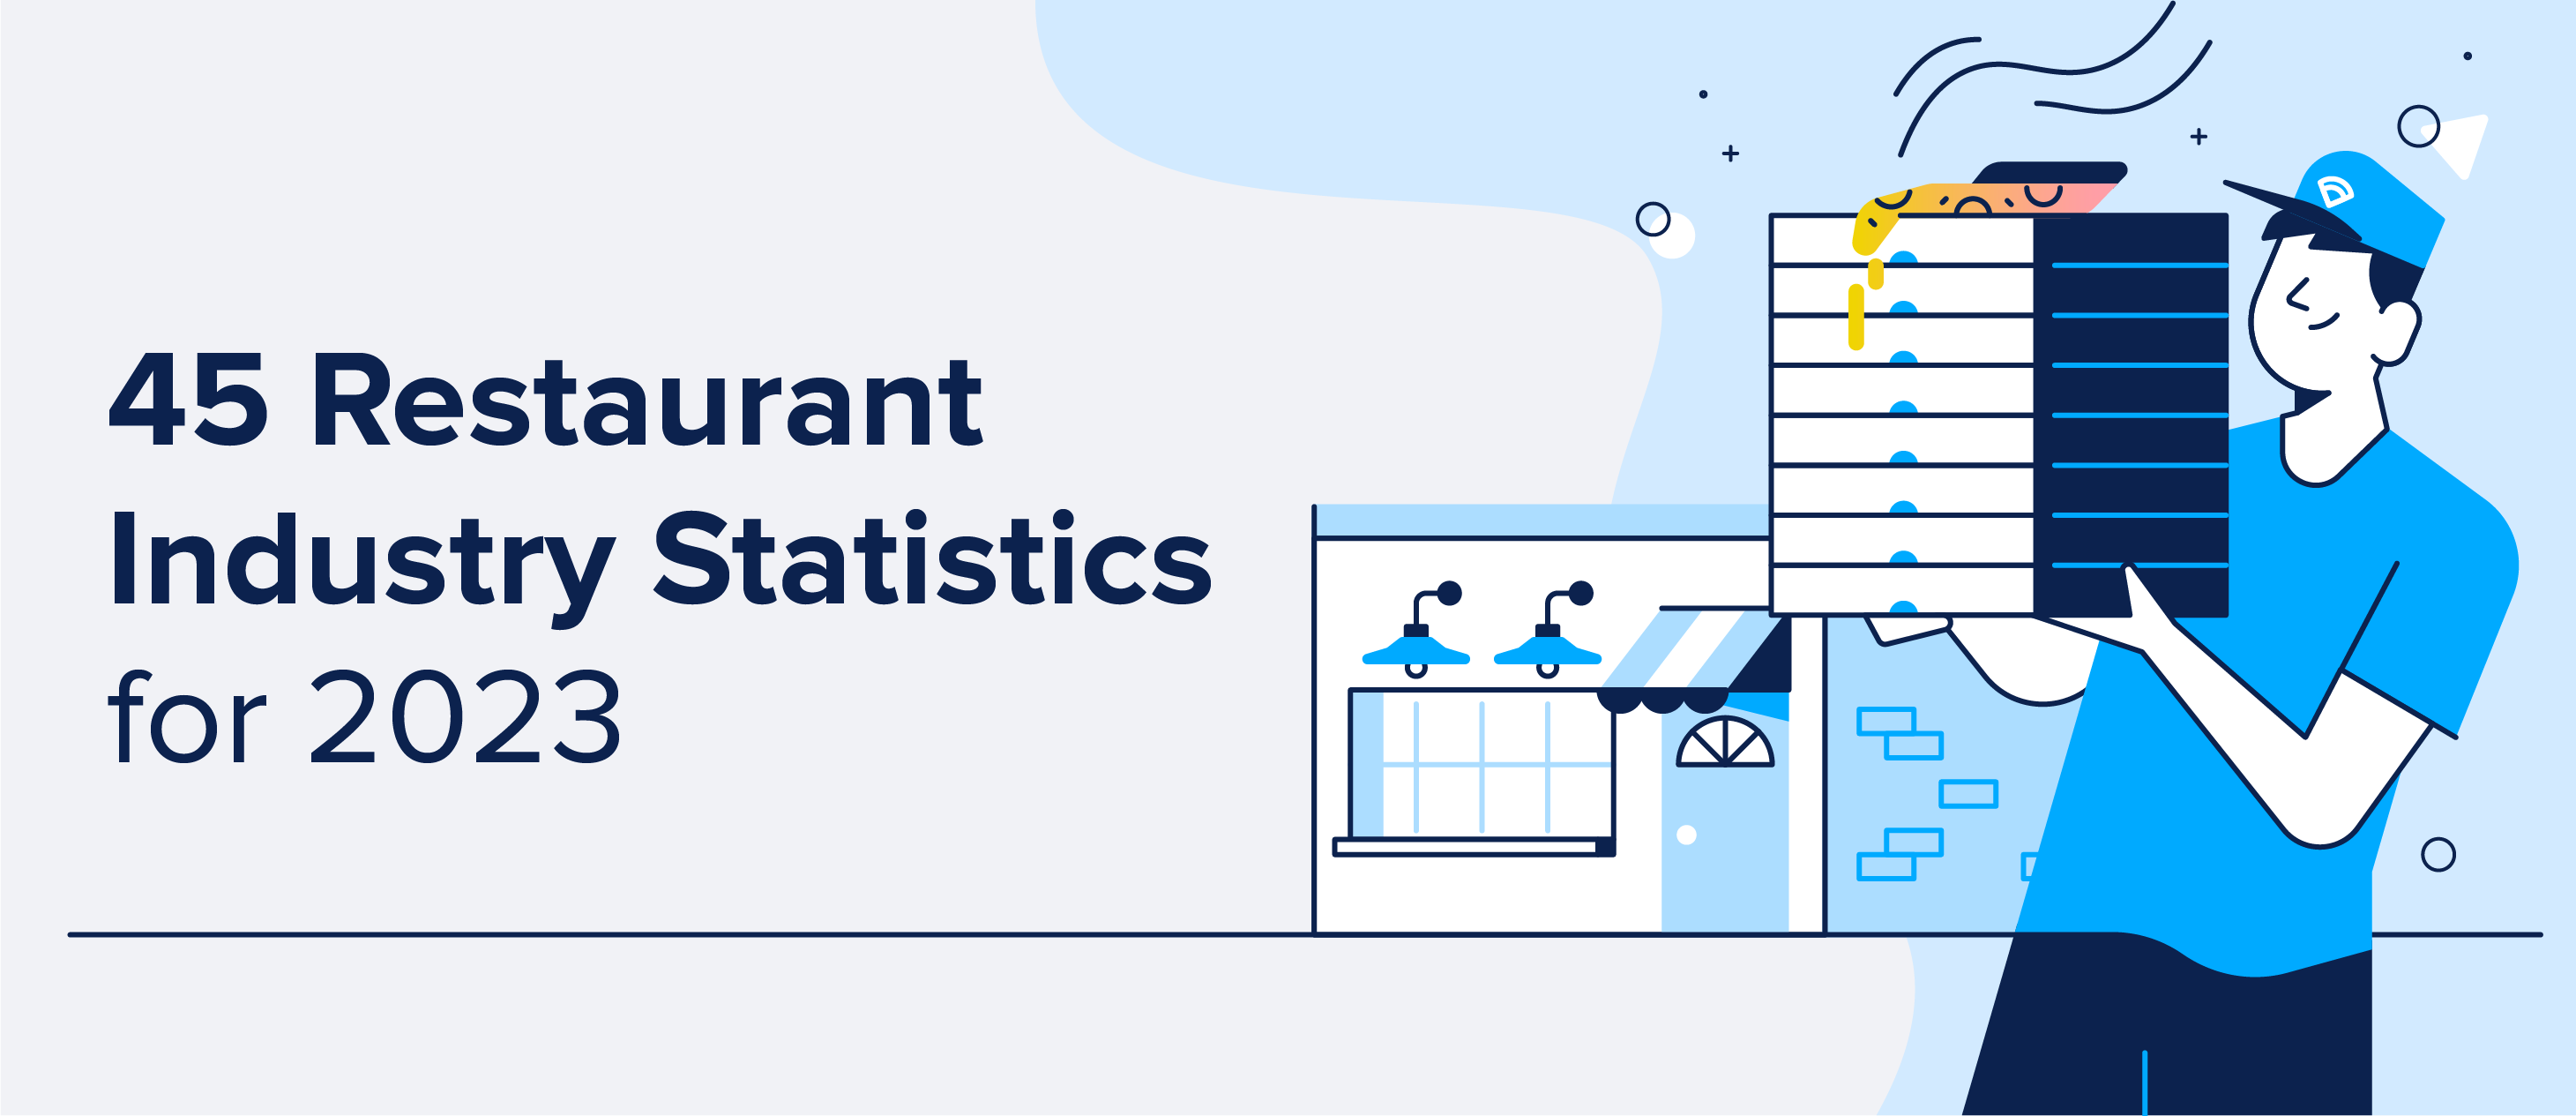
With a transformative year behind us where we relied on technology to support the food service industry, the restaurant industry is seeing a major change in the way technology is utilized. From streamlining back-of-house operations to staying up to date with the latest marketing and social media foodie trends, restaurant operators aren’t just using tech for payroll management and employee scheduling.
Continue reading for 45 restaurant industry statistics and trends that will help inspire restaurant owners and managers to continue elevating their business and stand out as a first-pick meal choice.
01
Restaurant software statistics
-
75% of restaurant operators intend to use new technology in 2023.
SpotOn
-
95% of restaurant owners believe that increasing automation for back-of-house duties would free up time to concentrate on other crucial company responsibilities.
Square
-
50% of those surveyed believe that improved technology for scheduling employees and better information regarding hours and/or rates would be beneficial.
HungerRush

-
By 2025, there are expected to be over 2.2 billion QR code payment users worldwide, a 70% increase from 1.5 billion in 2020.
Juniper Research
-
To boost staff productivity, 38% of restaurant owners intend to automate administrative activities.
Square
-
79% of consumers anticipate utilizing technology to place orders at casual eateries.
HungerRush
-
Consumers claim that restaurant technology, both online and in person, improves the visitor experience in 71% of cases.
Popmenu
-
81% of independent restaurants continue to use a traditional legacy POS system, despite the fact that 56% of them use technology to manage some elements of their operation.
SpotOn
-
65% of clients between the ages of 18 and 29 indicate that ordering food online is their preferred approach.
HungerRush
-
79% of customers agree that ordering is improved by kiosks.
Square
02
Restaurant marketing statistics
-
37% of diners use social media sites like Facebook, TikTok, or Instagram to find new dining options.
HungerRush
-
74% of MGH poll participants who frequently interact with and follow restaurants on social media are more inclined to go there and place an order for meals.
MGH
-
21% of people have made a dining or fast food decision based on social media posts or images.
Lunchbox
-
According to 85% of customers, the ability to quickly obtain reviews and information about restaurants online is vital.
HungerRush
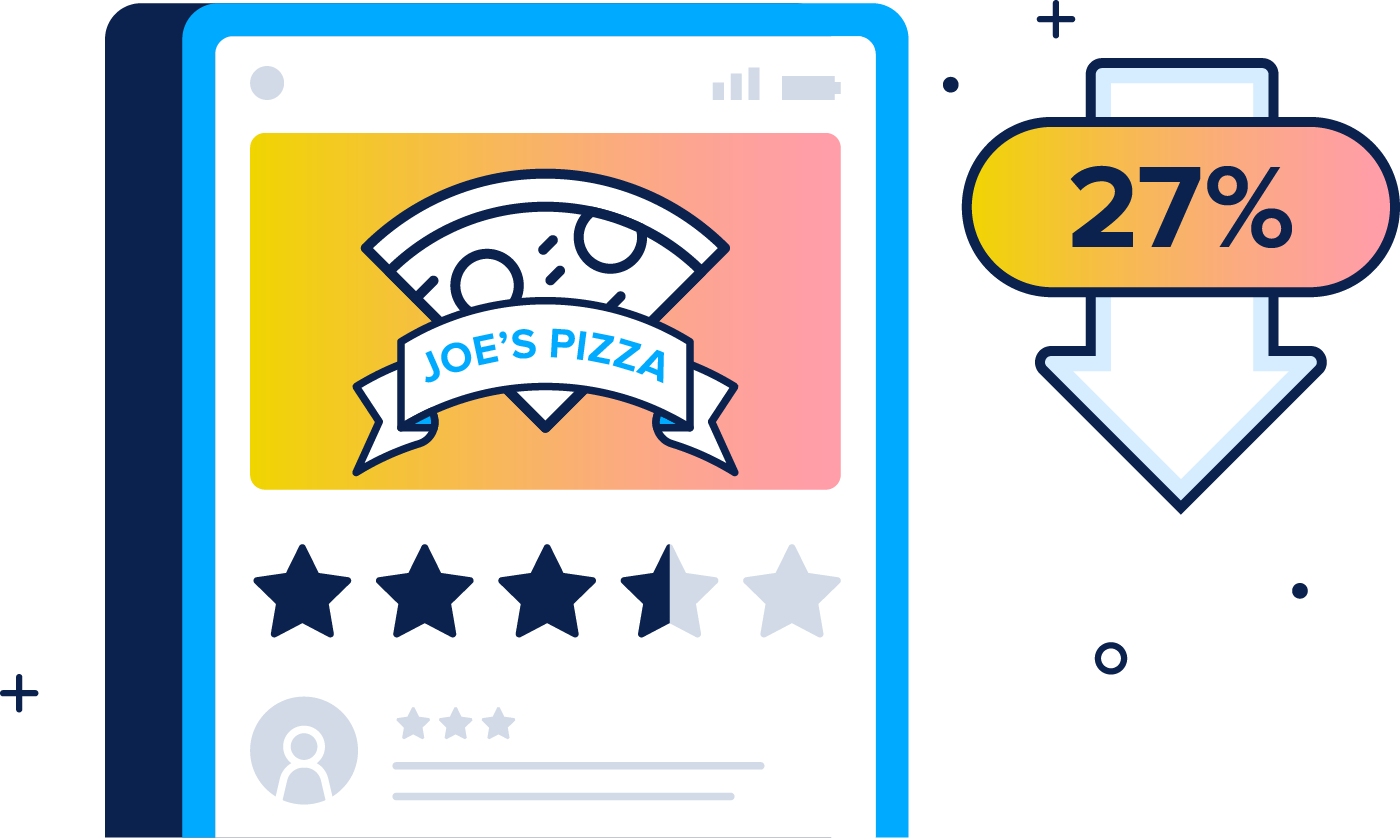
A half-star difference in a Yelp review rating can affect a restaurant’s sales by 27%.
HuffPost
03
Restaurant sales statistics
-
50% of restaurant owners anticipate making less profit in 2023.
National Restaurant Association
-
Sales for the entire U.S. food service industry is anticipated to reach $855 billion in 2023.
Datassential
-
30% of customers spend an average of $180 per week on food from restaurants.
Popmenu
-
Due to rising food costs, 87% of restaurants have raised menu prices.
National Restaurant Association
-
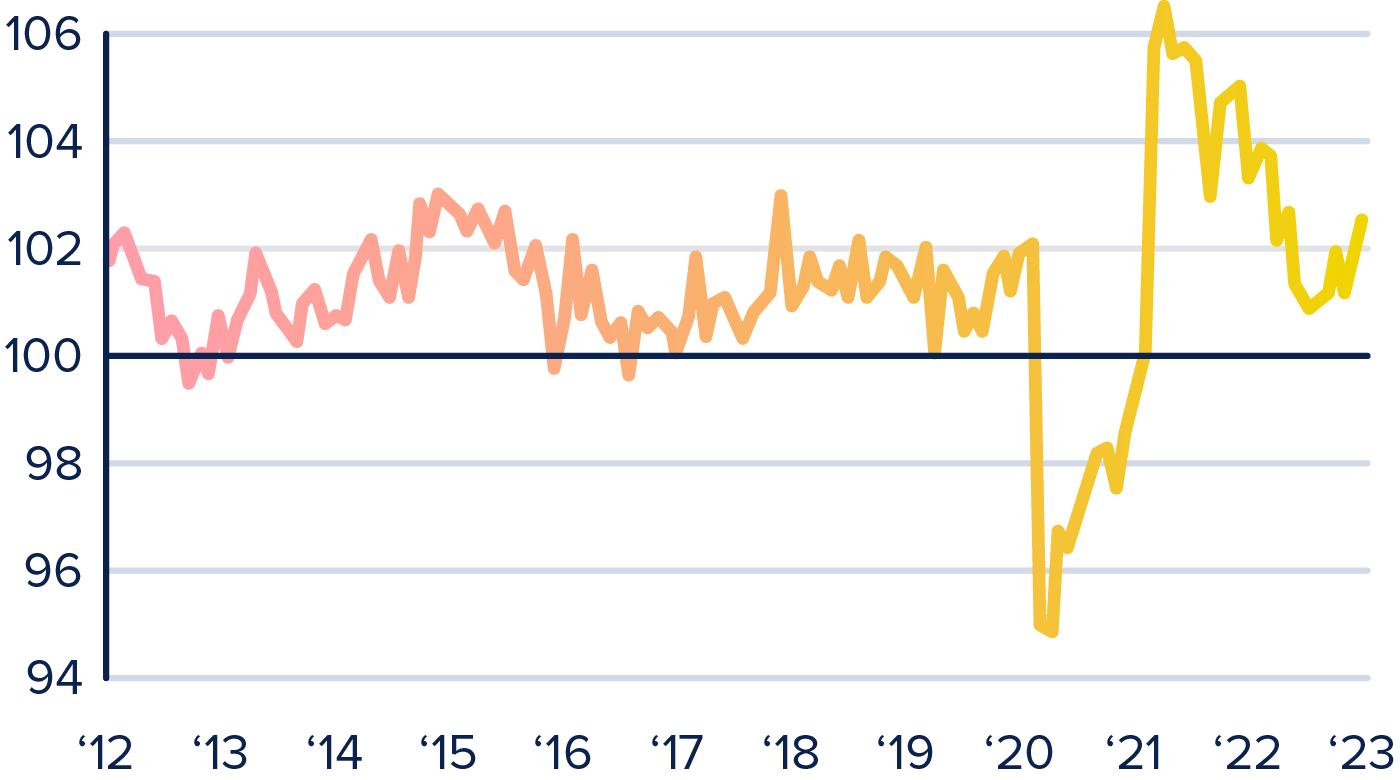
As of December 2022, the Restaurant Performance Index is at 101.8, up 0.7% from November 2022.
National Restaurant Association
-
87% of restaurant operators worry about inflation in 2023.
Datassential
-
On average, 21% of a restaurant’s revenue comes from goods and services such as merchandise other than their basic menu items.
Square
04
Restaurant consumer statistics
-
Despite rising menu prices, 58% of Americans are going out more frequently.
Popmenu
-
43% of diners have recorded or photographed a meal at a restaurant.
Datassential
-
When choosing where to eat, 43% of consumers identify the location as the most critical deciding factor.
HungerRush
-
61% of consumers choose restaurants over supermarkets due to convenience.
Popmenu
-
69% of customers place takeout or delivery orders as frequently as they did the year before.
Popmenu
-
63% of customers think delivery-only restaurants are acceptable as long as the food is prepared safely and is high quality.
Datassential
-
2 out of every 5 respondents (41%) say they order takeaway because it’s convenient to pick up meals on the way home.
HungerRush

05
Restaurant employment statistics
-
For 89% of operators, labor costs are a large concern.
National Restaurant Association
-
72% of employees rank team communication as essential for work satisfaction.
7shifts
-
84% of operators believe taking care of their employees’ mental health is important, and nearly half of those operators offer mental health benefits.
Datassential
-
2.2 million restaurant jobs have been created in the last 23 months.
National Restaurant Association
-
62% of restaurants lack the necessary staff to meet demand.
National Restaurant Association
-
The average hourly earnings for all restaurant employees in December 2022 was $19.42.
BLS
-
Wages are noted by 34.6% of restaurant employees as a reason for leaving a job or a reason they plan to.
7shifts
-
19% of restaurant operators have delayed hiring new employees.
National Restaurant Association
-
In a restaurant, around 33 cents of every dollar in sales goes to food and labor.
National Restaurant Association
-
From 2021 to 2031, it is anticipated that employment of food and beverage serving and related workers could increase overall by 9%, growing faster than the average for all other occupations.
BLS
-
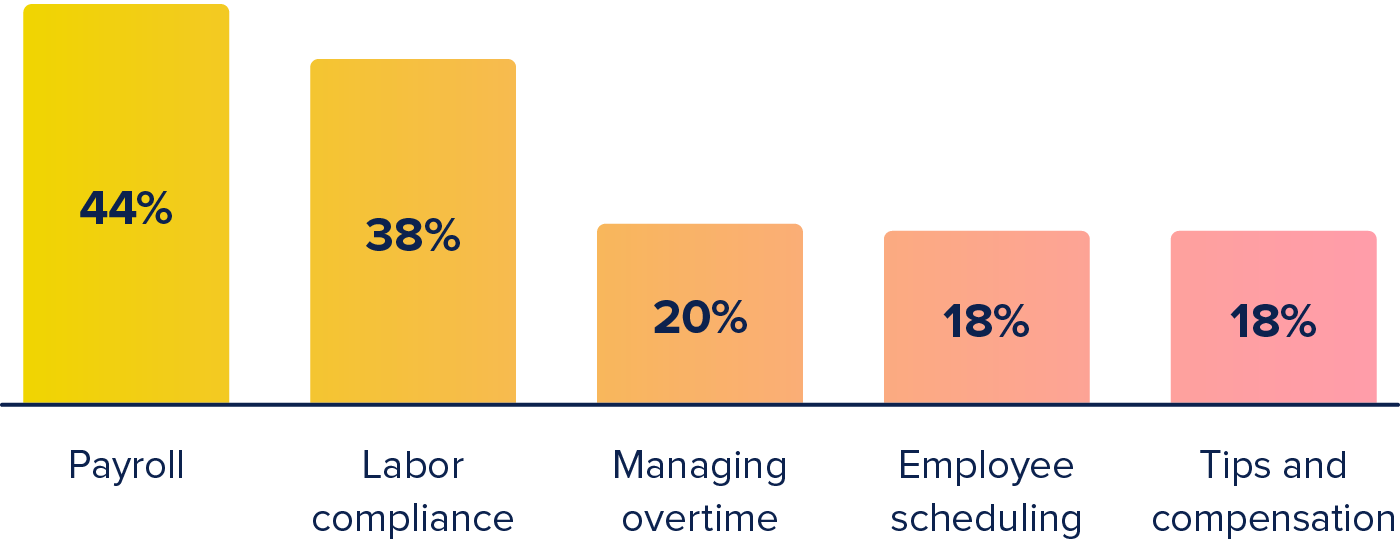
According to restaurant owners, labor management tasks like payroll (44%), labor compliance (38%), managing overtime (20%), employee scheduling (18%), and computing tips and compensation (18%) are becoming more challenging.
SpotOn
06
Restaurant menu statistics
-
73% of restaurants plan to continue increasing prices in 2023.
Restaurant365
-
Menu prices are estimated to rise by 5% in 2023.
Restaurant Dive
-
Over the next 12 months, 88% of restaurants intend to grow outside of their current menu choices.
Square
-
Using digital menu boards may result in an annual gain of $16,000 in in-store sales per unit.
Presto
-
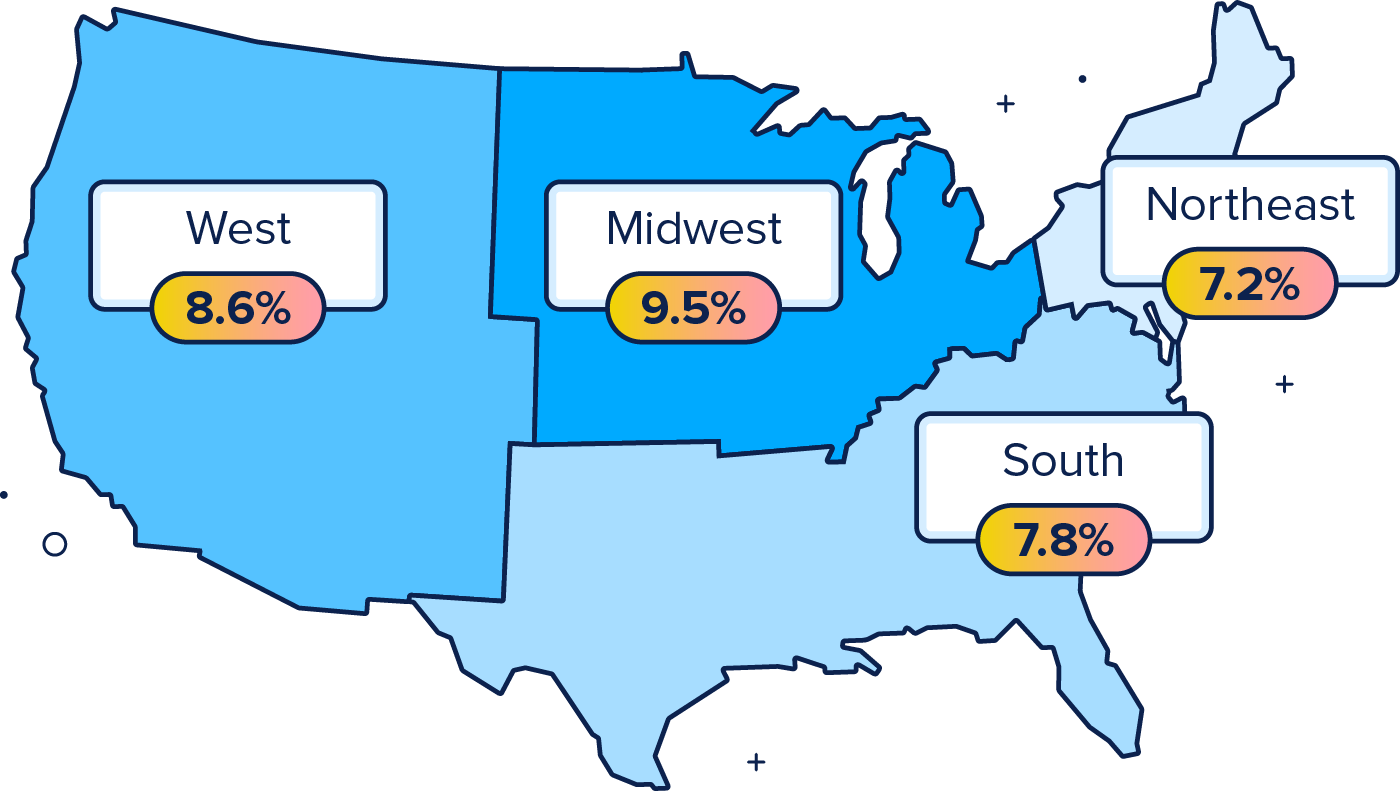
Menu prices have risen 8.2% in the last 12 years. The Midwest and West Coast regions have seen the most significant increase, at 9.5% and 8.6%, respectively.
National Restaurant Association
As these restaurant industry statistics reveal, popular food trends aren’t the most important thing to watch for as a restaurant operator. If you’re an operator looking for a foolproof staff scheduling system, you may enjoy using ZoomShift. ZoomShift melds timesheets, payroll, and employee schedules all into one user-friendly platform.
Sign up for a free trial of our scheduling software to manage your employees better and grow your restaurant.
JD enjoys teaching people how to use ZoomShift to save time spent on scheduling. He’s curious, likes learning new things everyday and playing the guitar (although it’s a work in progress).